7.2. Afregelingen
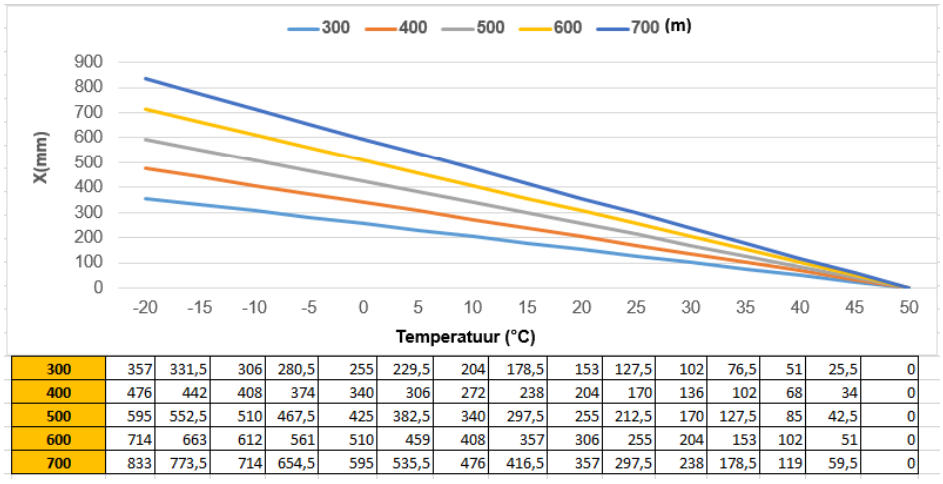
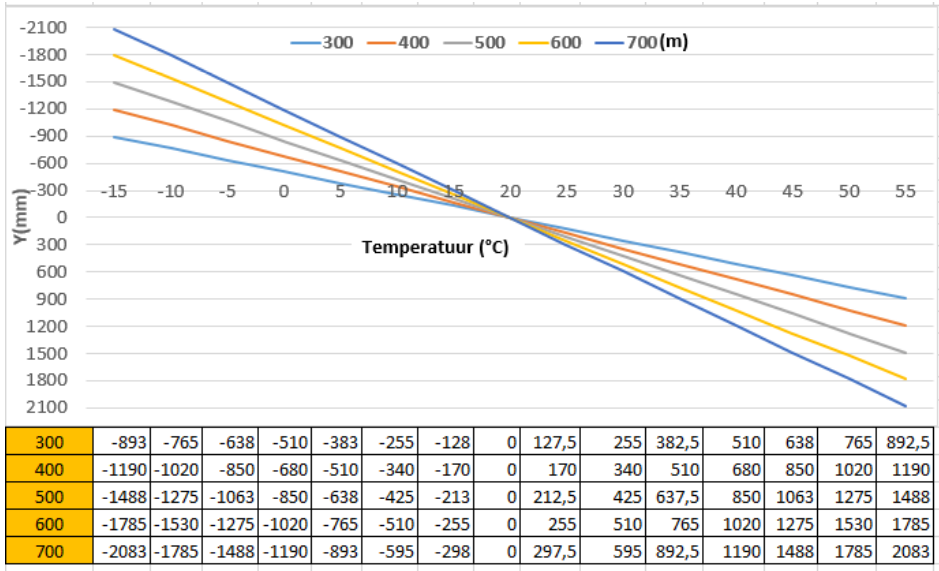
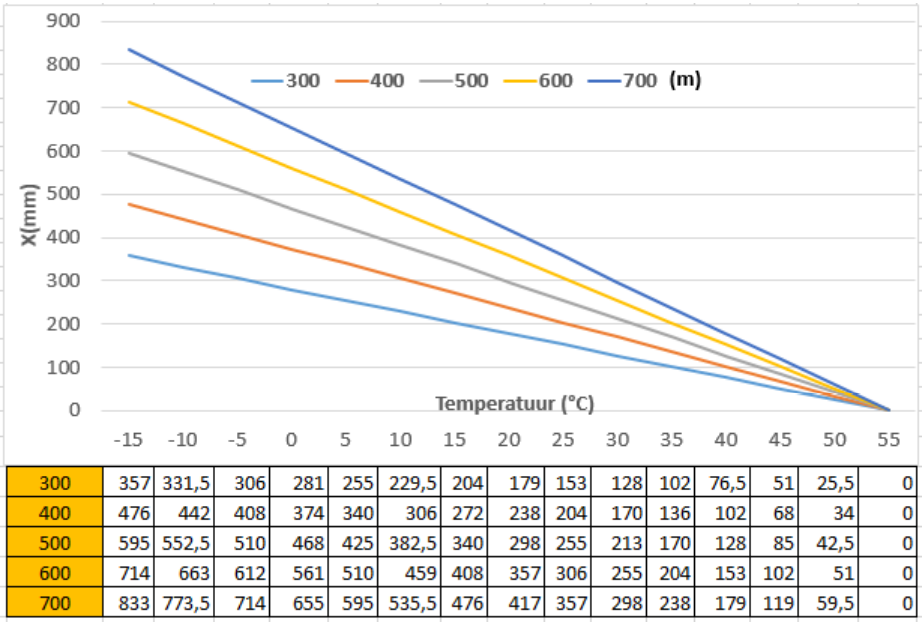
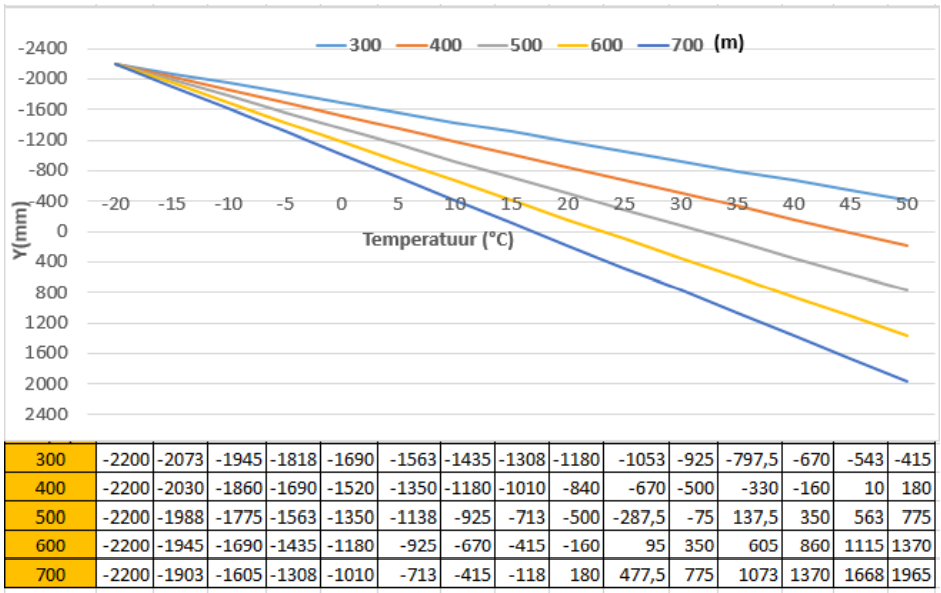
Grafieken van spantoestel met katrol op de R1 bovenleidingen (behalve L1)
Y(mm) = afstand geleidingsoog naar MIDDEN-geleidingsbuis als functie van de temperatuur (°C) en afstand L(m) tot het vast punt:
X = afstand tussen de stuiten (mm) als functie van de temperatuur (°C) en afstand L(m) tot het vast punt:
Symmetrisch rond + 20°C, voor elke L.
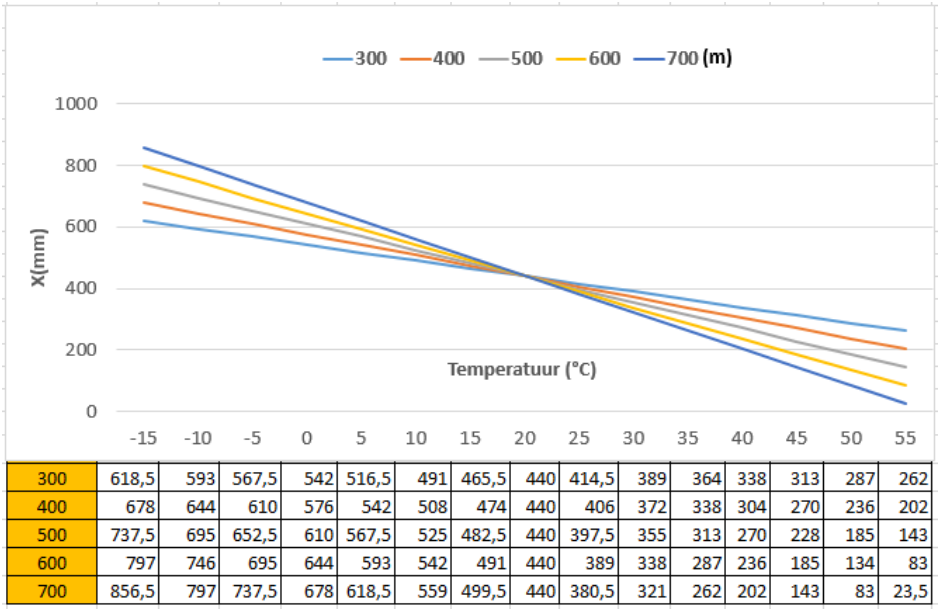
Grafieken van spantoestel met katrol op de bovenleiding van L1 (situatie tijdens de opstelling van lijn L1 - 1997)
Y(mm) = afstand geleidingsoog naar MIDDEN-geleidingsbuis als functie van de temperatuur (°C) en afstand L(m) tot het vast punt:
X = afstand tussen de stuiten (mm) als functie van de temperatuur (°C) en afstand L(m) tot het vast punt:
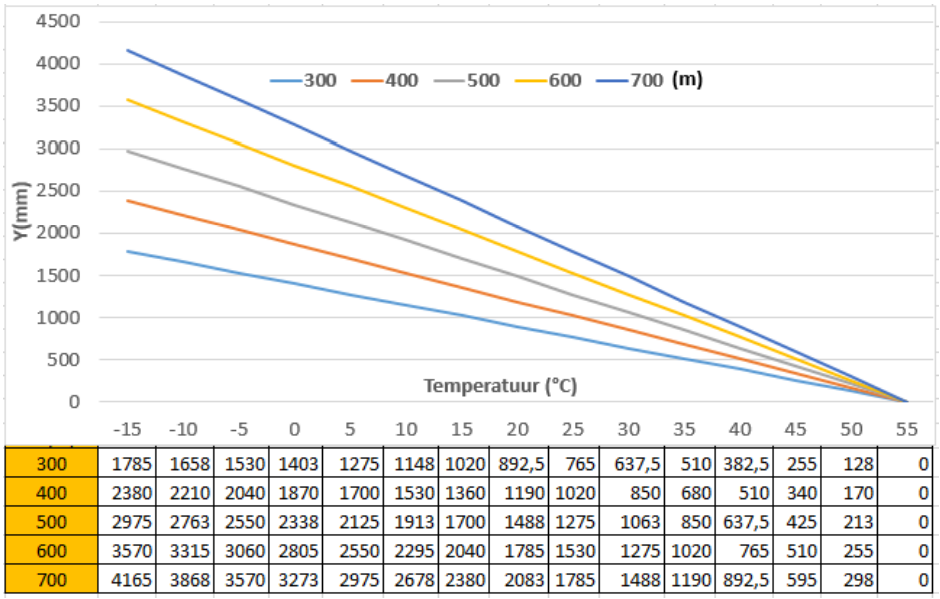
Grafieken van spantoestel met katrol op een R1-120 bovenleiding
Y(mm) = afstand geleidingsoog naar MIDDEN-geleidingsbuis als functie van de temperatuur (°C) en afstand L(m) tot het vast punt:
X = afstand tussen de stuiten (mm) als functie van de temperatuur (°C) en afstand L(m) tot het vast punt: